Pre-process
Read each frame, convert to greyscale, and separate foreground from background with an Otsu threshold.
This project segments cells in time-series microscopy images, tracks each cell across frames with the TrackCells algorithm, and outputs trajectories, speed, morphology, and texture features for downstream analysis.
Methodology
The pipeline stays short and explicit: turn each image into measurable cell objects, then connect the same cell across frames using a distance gate plus an area-change rule.
Read each frame, convert to greyscale, and separate foreground from background with an Otsu threshold.
Clean the binary mask with opening, closing, and hole-filling, then label connected cell regions.
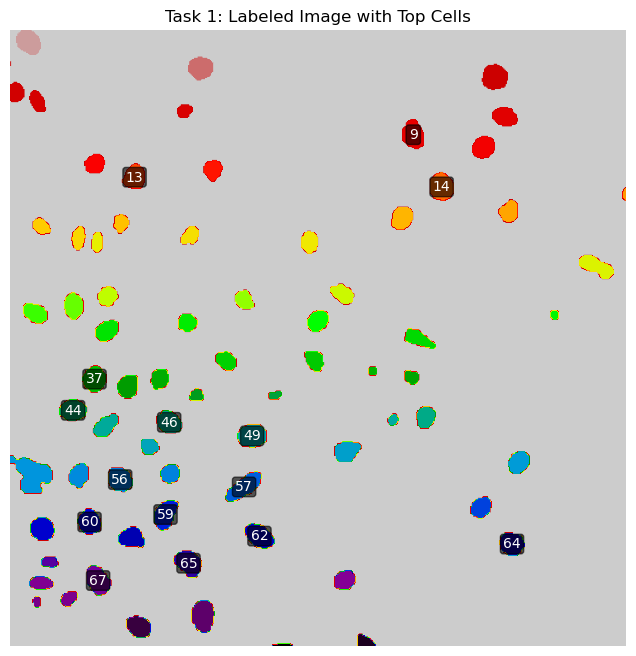
Filter labels by area range and distance from the image border, picking 15 cells in the first frame for tracking.
For each cell, find nearby candidates in the next frame and use area change to classify normal motion, division, or anomaly.
Algorithm 1
The tiered matching scheme — gating by distance, accepting normal movement, detecting division by paired-area, and falling back on the largest candidate for fusion — is my own design, captured here as Algorithm 1 in the project report. Lines highlight as the demo animation steps through Measure → Gate → Verify → Write.
Interactive demo
The animation breaks each TrackCells decision into four readable stages: measure, gate candidates by distance, verify by area change, then write the trajectory.
Results
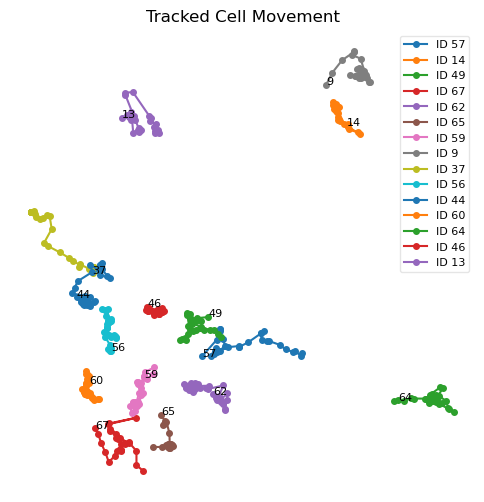
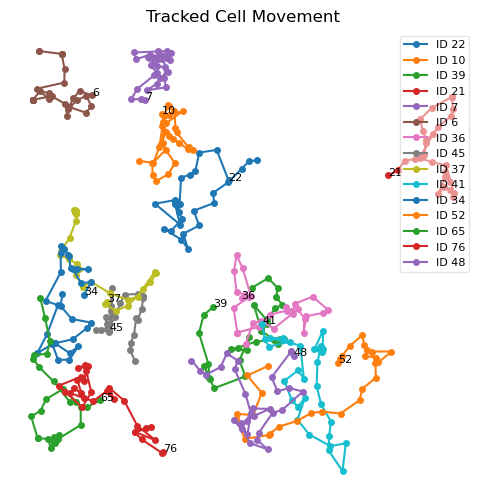
Three figures from the project report: first-frame segmentation with selected cells, and per-group trajectories over 30 frames.
Methodology & attribution
Algorithm authorship. The tiered cross-frame matching scheme presented in Algorithm 1 — gating by distance, accepting normal movement, detecting cell division by paired-area sum, and falling back to the largest candidate for fusion — is my own design and contribution to this project. The pseudocode on this page is a faithful transcription of Algorithm 1 in the project report.
Foundations the approach builds on. Cell segmentation and per-frame feature extraction follow standard image-processing practice (connected-component labelling, region morphometrics). For surveys of cell-tracking strategies the work was informed by general computer-vision and biomedical-image-analysis literature on object tracking and lineage reconstruction.